Find the right data.
Fast.
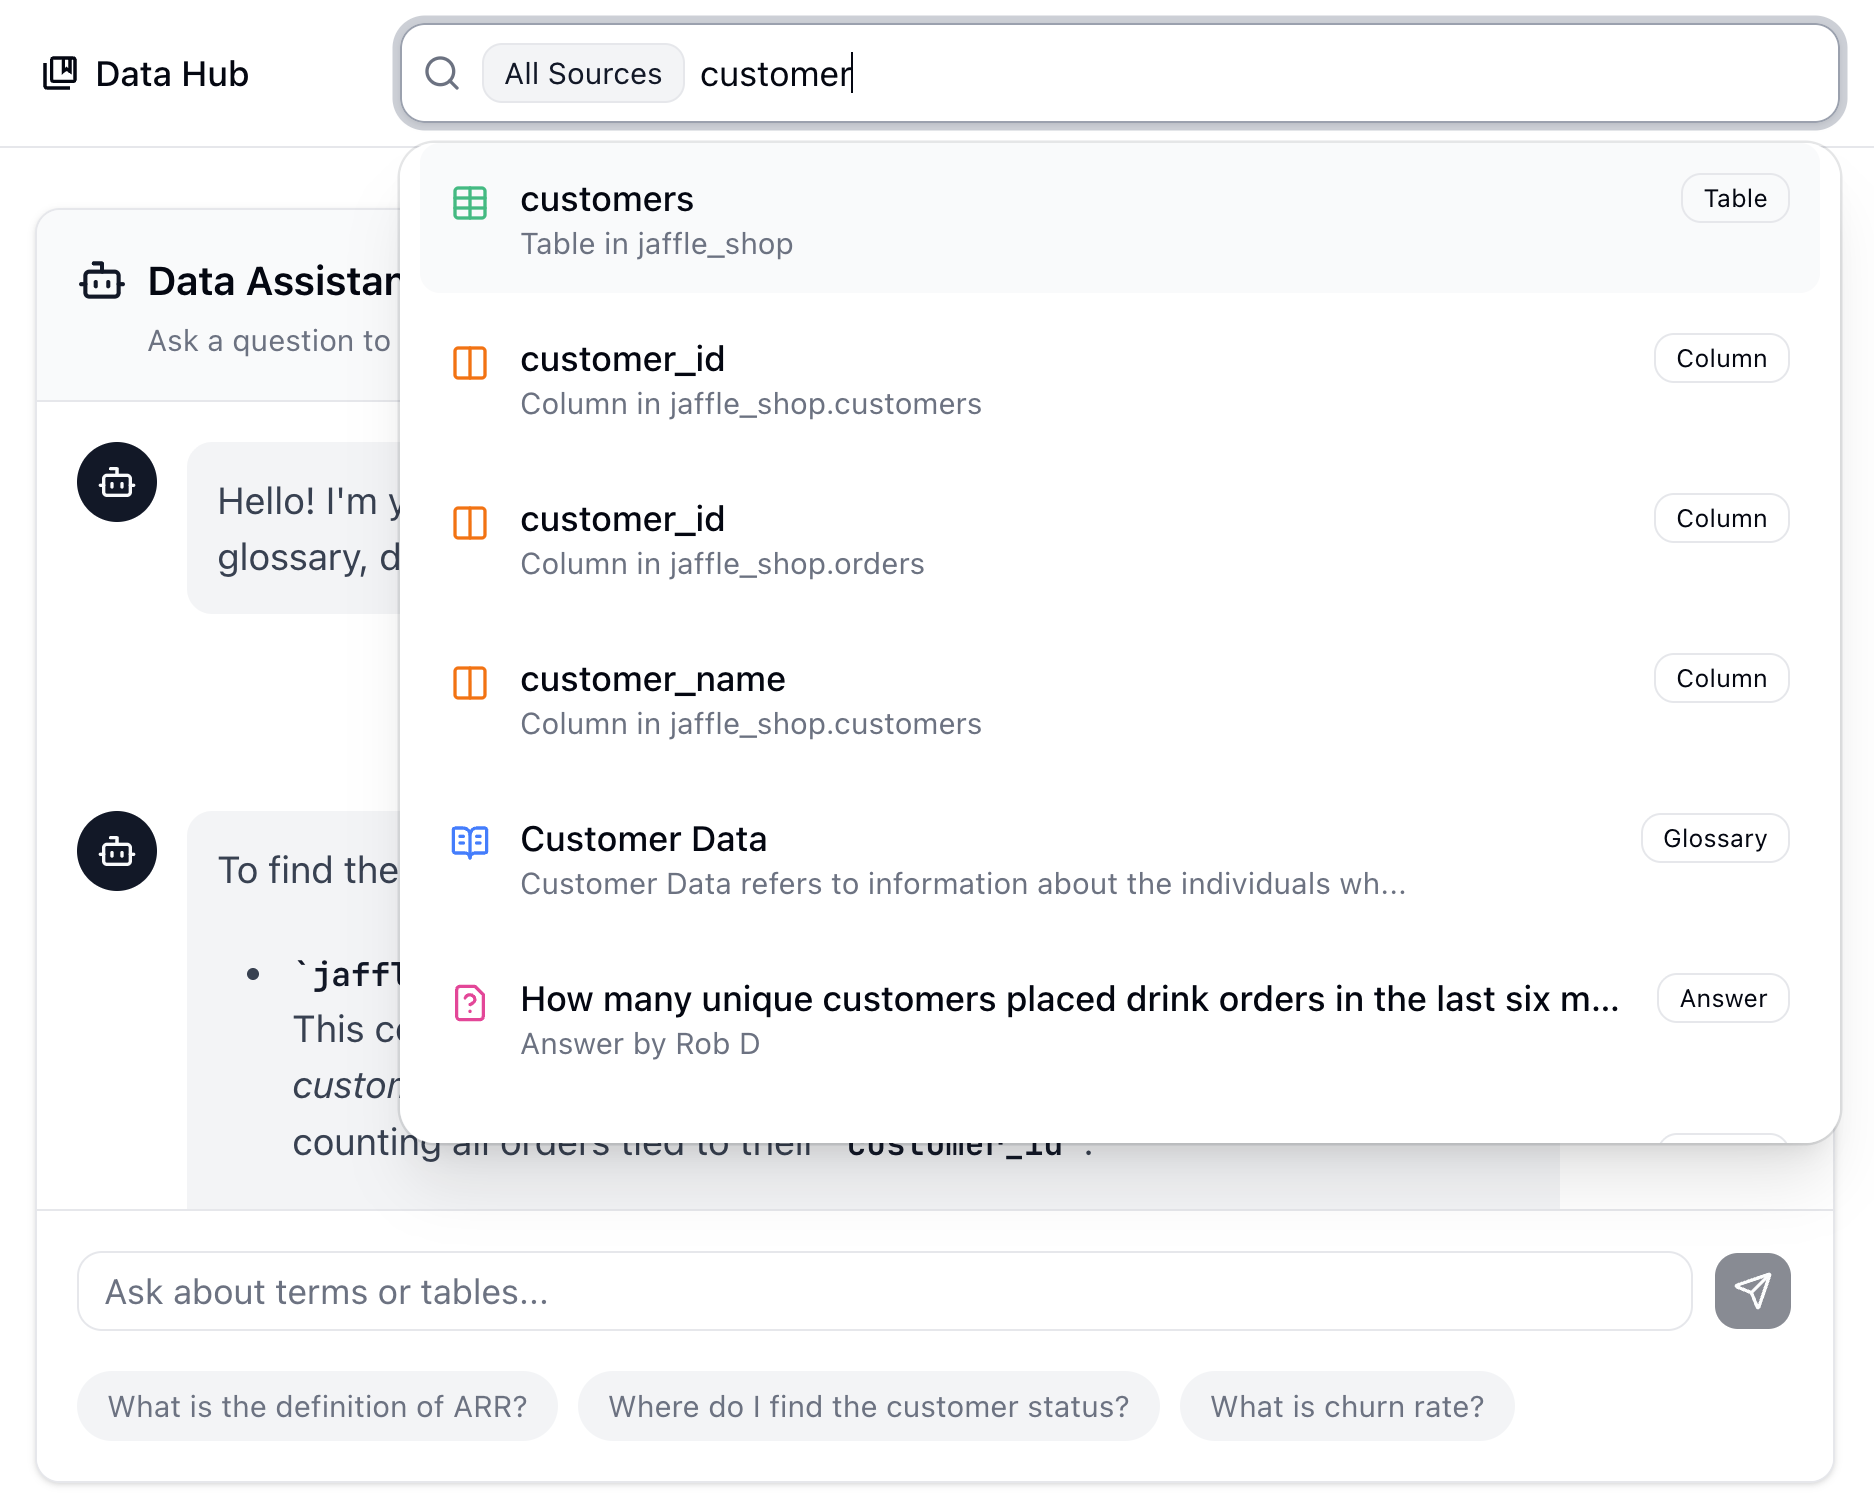
Help your team find data, understand it, and get answers fast. Ask in Slack or Microsoft Teams, or ask and search in the runQL app.
|
activation_date
This is the date when the customer completed the onboarding flow and made their first payment.
|
activation_date
This is the date when the customer completed the onboarding flow and made their first payment.